
Ahead of the historic Texas Blue Wave that crested last week, many data analysts and number crunchers scrutinized the early vote for signs of the eventual outcomes. Could tracking, day by day, the demographic and partisan profile of voters, actually inform us about who would win the key races?
Specifically, no. As breakout analyst Ethan Chen of DeCalibrate (to which you should subscribe) has said, early vote analysis tells you zero about persuasion, i.e. the changes of individual voters beyond imputed past partisan behavior. As an example, in North Carolina in 2024, Republican President Donald Trump won the state by 3 points, while Democratic Gov. Josh Stein won by 15. The same early voters contributed to this 18-point ticket split. No pre-election look at who is voting could have estimated that delta. Nevertheless, I still wanted to build on my 2024 early vote analysis of Cameron County (where I lived at the time).
Using voter file data for 24 counties representing a cross-section of Texas’s demographics, I geocoded every voter in the lists and cross-referenced census geography to model race for individual voters. Using Catalist’s voterfile-validated 2024 post-election data, I used the gathered demographic data to create partisan priors that were blended with precinct geographic data and primary participation data in order to model 2024 voter partisanship.
Using 2024 partisanship for the voters, I aimed to model the “recalled 2024 preference” of the voters showing up who cast ballots two years ago. This question, being validated by Catalist data, is infinitely easier to measure than attempting to guess 2026 persuasion. Measuring recall would give the yardstick required for Democrats to hit 50%. A closer recalled electorate would imply fewer GOP voters required to switch over to make a Democratic victory possible.
After tracking 12 days of early voting data that got steadily more Republican, the pool of 2024 voters would have voted for Trump by around 9.7. This was roughly 4 points of turnout differential from 2024, when the state voted for Trump by 13.7. Pre-election polling that showed Talarico ahead in Trump +14 electorates implied that a Trump +9.7 electorate should favor him as well.
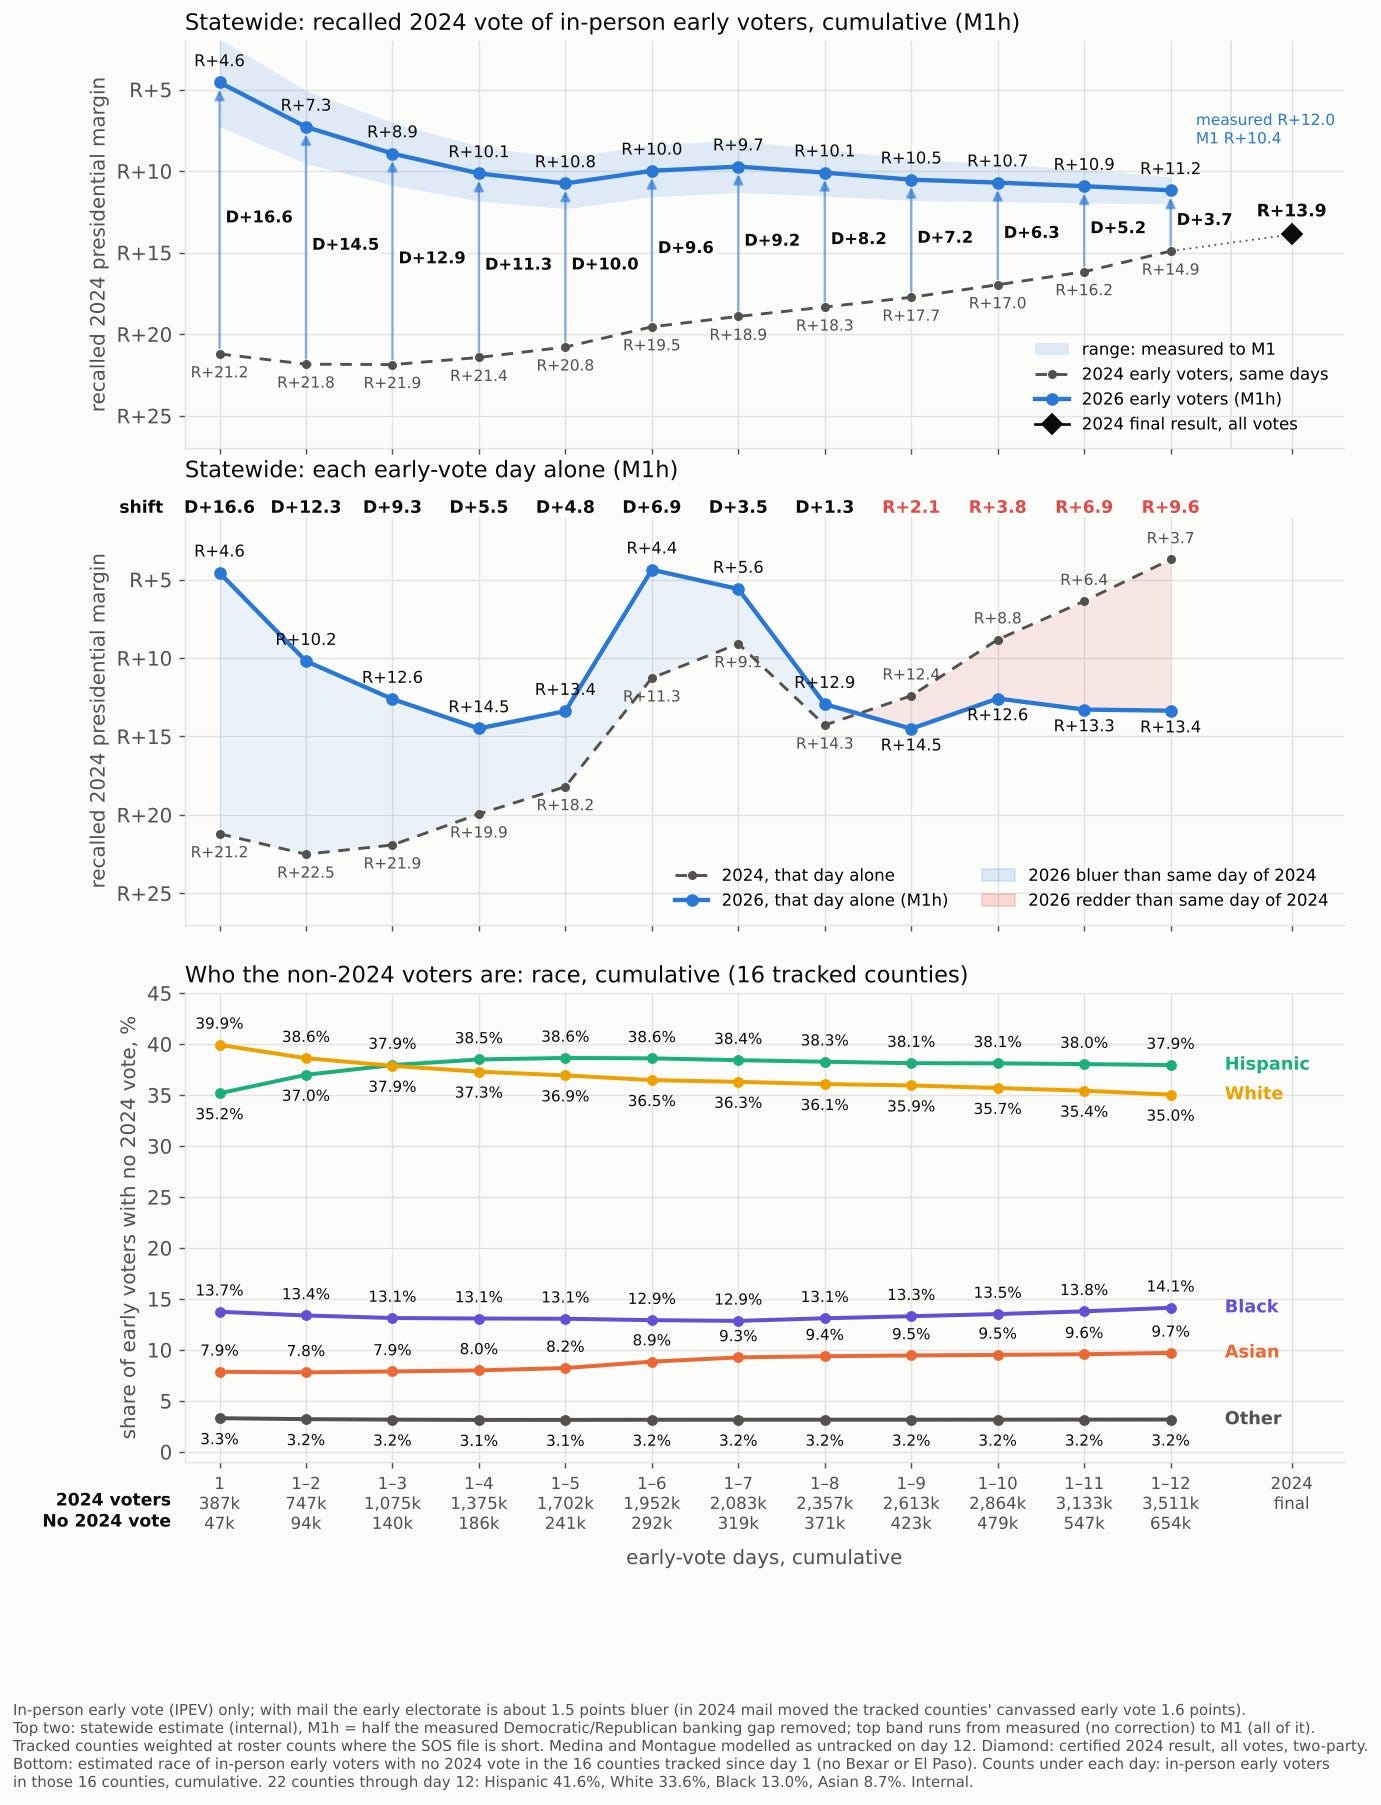
When estimating the Election Day surge, Texas’s Tuesday vote usually accounts for 20 to 35 percent of the total ballots cast. The number is usually larger in midterms. The Republican sources I talked to for guidance on crafting assumptions helped steelman a conservative case, and estimated 2.7 million Election Day voters. These voters would, in theory, be far more Republican than the younger, minority-heavy electorate that showed up during early voting. Based on 2022 and 2024, Election Day voting shifted the early vote result a few points towards the GOP. If this pattern manifested in 2026, given the relatively lackluster GOP turnout, I figured it would be a similar, but diminished shift. I thus guessed the final post-election electorate would have voted for Trump by 11 points among 2024 voters.
Based on this, I had to estimate how much persuasion Democrats would really obtain out of this electorate. Given the observed phenomenon of younger and nonwhite Trump voters who respond to polls lying about their vote choice, polls were underestimating the shift away from the GOP. Out of an abundance of caution, I dampened these persuasion effects, to protect against non-response bias from shy hard-right Republican voters that do not answer polls. Thus, the 14-point persuasion effects seen in the polls went down to something closer to 7.
Factoring in the 1.2 million or so voters who did not show up in 2024, the picture changed. Given that these people skewed overwhelmingly young, nonwhite, and female, and had overwhelmingly Democratic primary ballots in 2026, they likely would add 3-4 points of margin to the Democratic ticket. I thus said that Talarico would win by 1, and Abbott would win by 3.
Of course, Talarico won by 12, and Hinojosa won by 7. So my own guess about persuasion was wrong, as was everyone else’s. No serious analyst would have guessed that Democrats would win a Texas Senate election by double digits, and carry every statewide Democrat to a sweep.
No serious analyst would have predicted that low-propensity minorities swing massively to Democrats after they bolted to Trump in the previous two presidential elections. Even if you assume non-2024 voters broke proportionally to their primary participation (78% Democratic, 22% Republican), the 2024 electorate would have to swing 17 points on persuasion to match Talarico’s actual margin. The past 10 years’ hyper-polarized electorates made such swings unthinkable on this scale.
So what then, did the early vote analysis get right? Quite a bit, in fact.
First, the temporal early vote changing was something the analysis caught onto very well. Using 2024 as a benchmark, I expected the electorate to blueshift through the 12 days of the early voting period. However, unlike two years ago when Republicans had the enthusiasm edge, Democrats front-loaded their most dependable voters. The GOP picked up strength in the remaining days.
This carried further into Election Day. In 2024, suburban counties like Montgomery, Denton, and Tarrant had a blueshift from early voting to Election Day. Latino counties, on the other hand, shifted redder. In 2026, Election Day was redder in 205 out of 254 counties. During both years, latter days of the early voting period saw more lower-propensity minorities come out. As these people disproportionately swung to Trump, the 2024 recall estimate was redder than their implied 2026 partisanship was likely to be.
The early vote correctly diagnosed that rural GOP turnout was flagging, and that lower-propensity conservative voters were not showing up. Republican voters who voted in the past 3 general elections (2020, 2022, and 2024) were matching Democrats who did the same. For less frequent voters, the early voter sample was 6-7 points more pro-Harris than the equivalent in 2024.
The GOP elected officials in Texas, including Sen. Ted Cruz, all saw similar figures in their own data. Day after day, they warned that weak low-engagement GOP turnout would result in a Democratic sweep. Out of caution, I conservatively assumed the low-engagement MAGA wave would flock to the polls on Election Day.
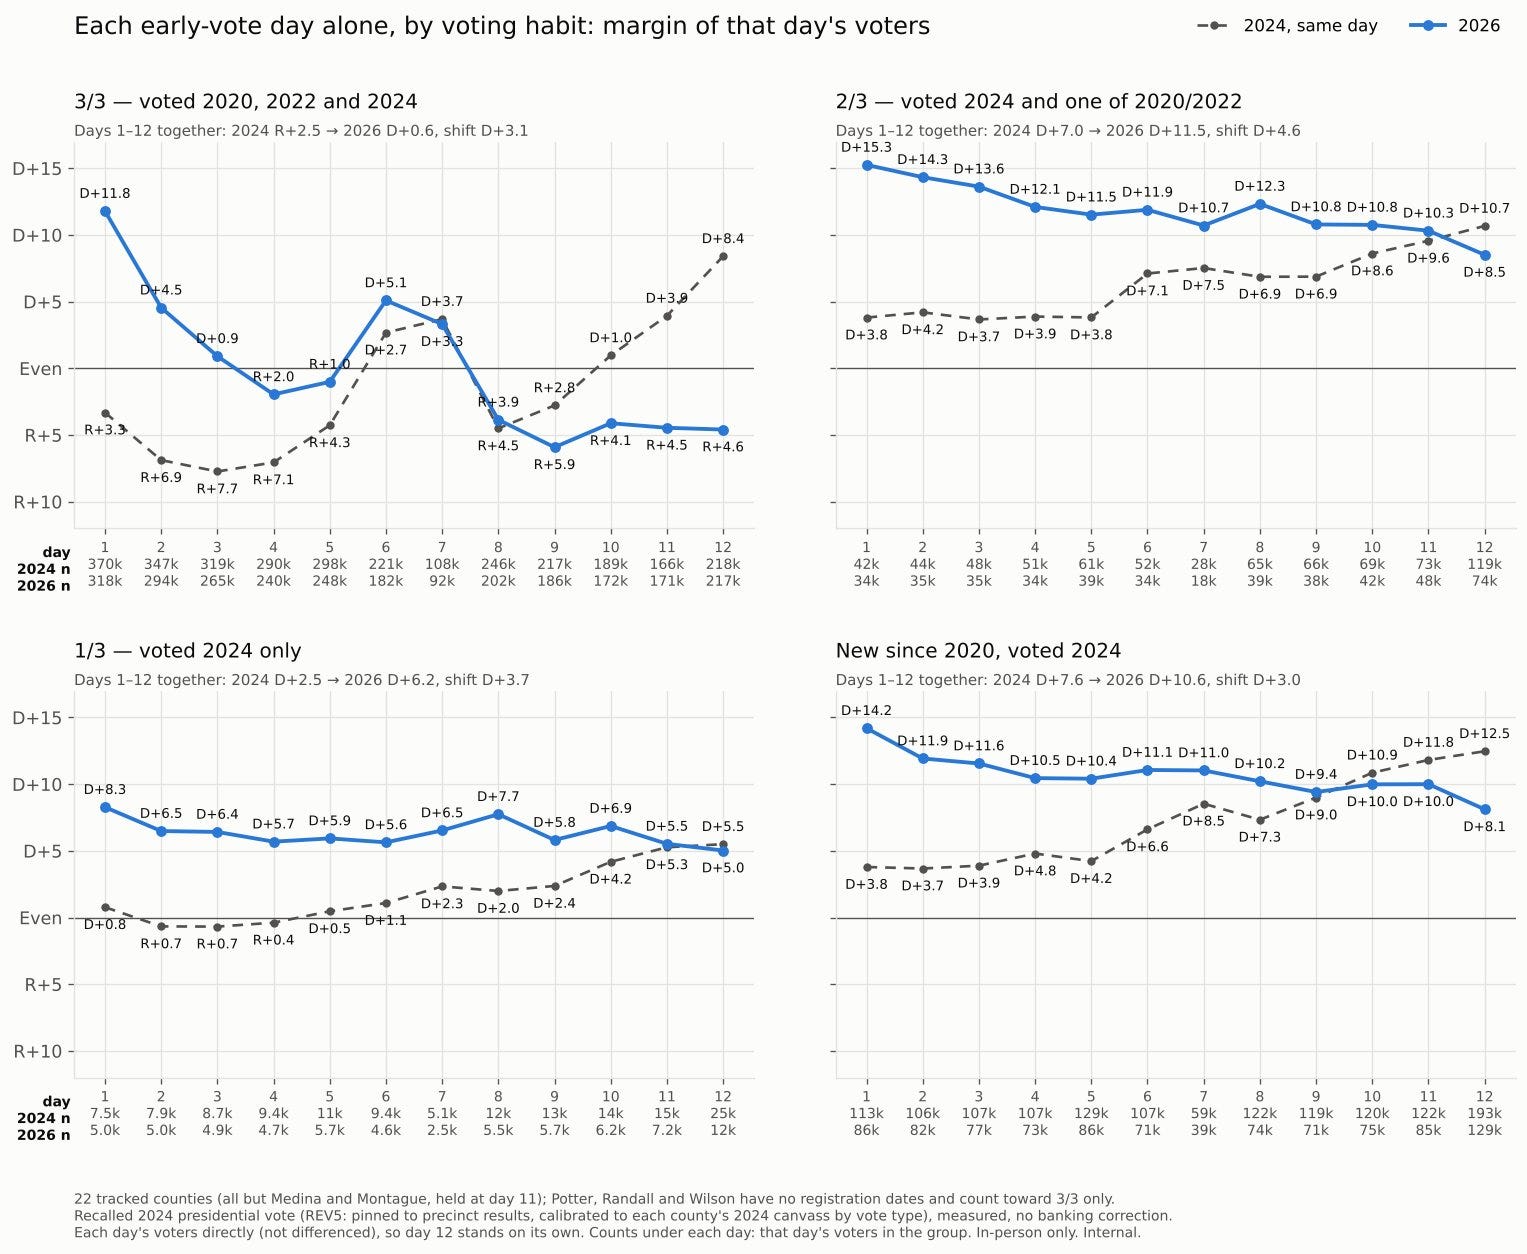
Only 2.1 million people cast ballots on Election Day, 21% of the total. Unlike past early voting models, like the Georgia Runoff Model so expertly crafted by Lakshya Jain, there is no benchmark to compare Election Day turnout to. I had to use a guess, and I picked a deliberately conservative one that didn’t materialize: 600,000 fewer voters than I guessed showed up.
The early vote also showed that younger and nonwhite voters were punching dramatically above their weight. As an example, the Latino precincts in Harris County (Houston) turned out at higher rates relative to 2024 than working-class white areas. In Texas politics, this is unheard of. It also showed the dramatic growth in voters who didn’t participate in 2024, predominantly in Democratic-leaning and minority-heavy areas.
For the question most people are interested in, i.e., who will win, it can’t directly tell you. It can tell you a lot about who is motivated, and how likely enthusiasm gaps are to close.
As a test case of the recall question, I experimented with estimating the voter pool that showed up to a similarly competitive election in a red district: the Senate District 9 Special Election.
In northwest Tarrant County, SD-09 has been red for decades, taking in a portion of Fort Worth and its suburbs. In the special election after Sen. Kelly Hancock became State Comptroller, three candidates ran. The two Republicans were former Southlake mayor John Huffman and MAGA activist Leigh Wambsganss, and the Democrats picked Air Force veteran Taylor Rehmet as their nominee.
Given that Trump won this seat by 17, the GOP was easily expected to hold the seat. But GOP infighting between Wambsganss and Huffman mirrored the ongoing wider civil war among Republicans in the state. Rehmet got 47% in the first round, and then increased his total share in the runoff to 57%. Not only did Democrats flip the seat, they blew the doors off. The question had to be asked then, how much of this was due to turnout?
Using the early vote analysis, the 2024 voters that showed up to vote in the runoff would have supported Trump by 20.4 points - making the electorate redder than the 2024 result. This means that Rehmet won a significant portion of red voters. If you assume that the 6% of the electorate that didn’t vote in 2024 all went to Rehmet (an assumption to calculate a lower bound for crossover), then 24% of the Trump voters are implied to have voted for Rehmet. The actual estimate I will defend is closer to 28-29%.
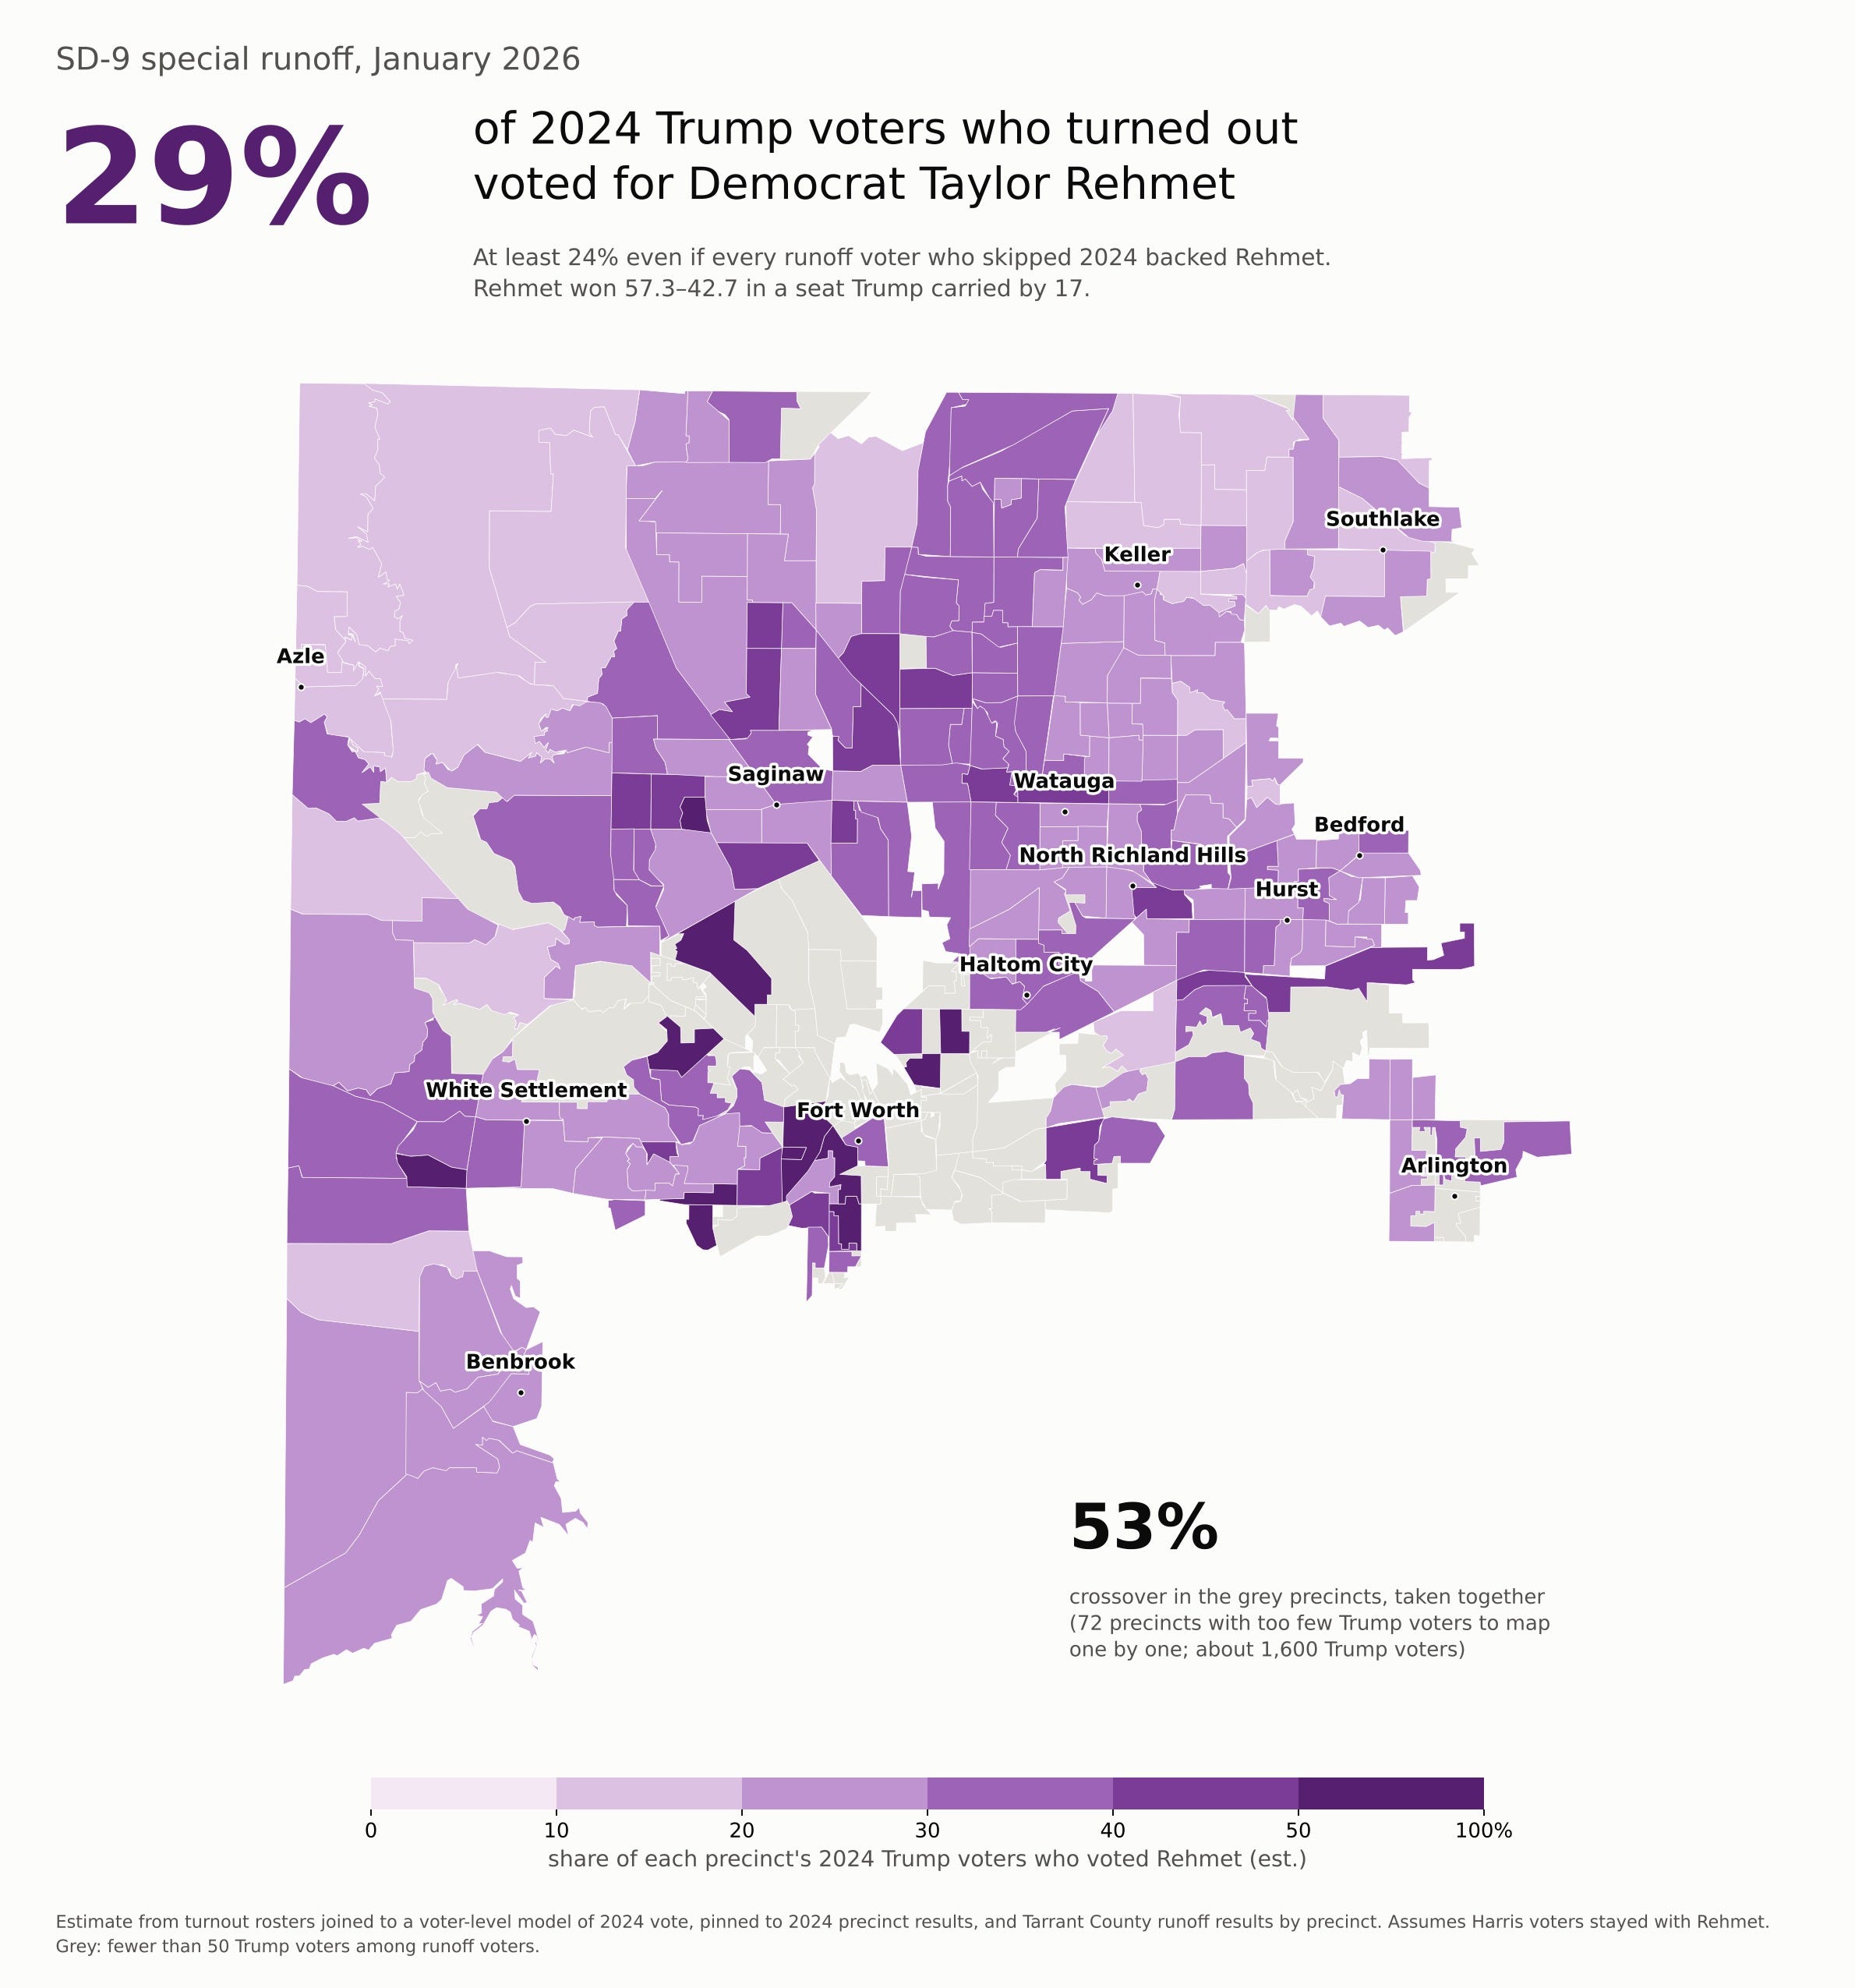
A quarter of one party’s voters defecting is unheard of. But last Tuesday, James Talarico won SD-09 by 8 - a 25 point shift. Talarico beat Ken Paxton, who, like Wambsganss, typifies the far-right faction of the GOP that is alienating traditional conservative voters. Municipalities like White Settlement, Keller, and Watauga all voted Democratic this time, mirroring Rehmet’s special election coalition.
Having spent so much time looking at the data, Tuesday’s result should have been far easier to convey. What Taylor Rehmet achieved in Tarrant, James Talarico, Gina Hinojosa, and the Democratic slate achieved across the other 253 counties of the state as well. November 3 was the Leigh Wambsganss Election - enough erstwhile Republican voters teamed up with energized Democrats to deal far-right Republicanism a grievous blow in the state.
Concluding this early vote analysis, I believe that looking at pre-Election Day votes is useful if you have well-formed priors about how voters behave. Simply looking at turnout data by precincts will not suffice - since there are often intra-precinct turnout differentials by race and party one cannot directly observe.
Given my lack of a statewide voter file, I think it comfortably narrated the story of the 2026 election, and helped color the range of possible outcomes. In 2028 and beyond, I think a better-developed method for early vote analysis is possible with a more robust voter file. I look forward to the Texas Secretary of State and various counties providing their Election Day rosters to aid in conducting after-action post-mortems of the individual votes.